Case study / Profit · Amazon brand management →
Quarterly net profit grew 4.9x in four quarters
Quarterly net profit rose from €5,171 to €25,341, and net margin nearly doubled to 25.6%.
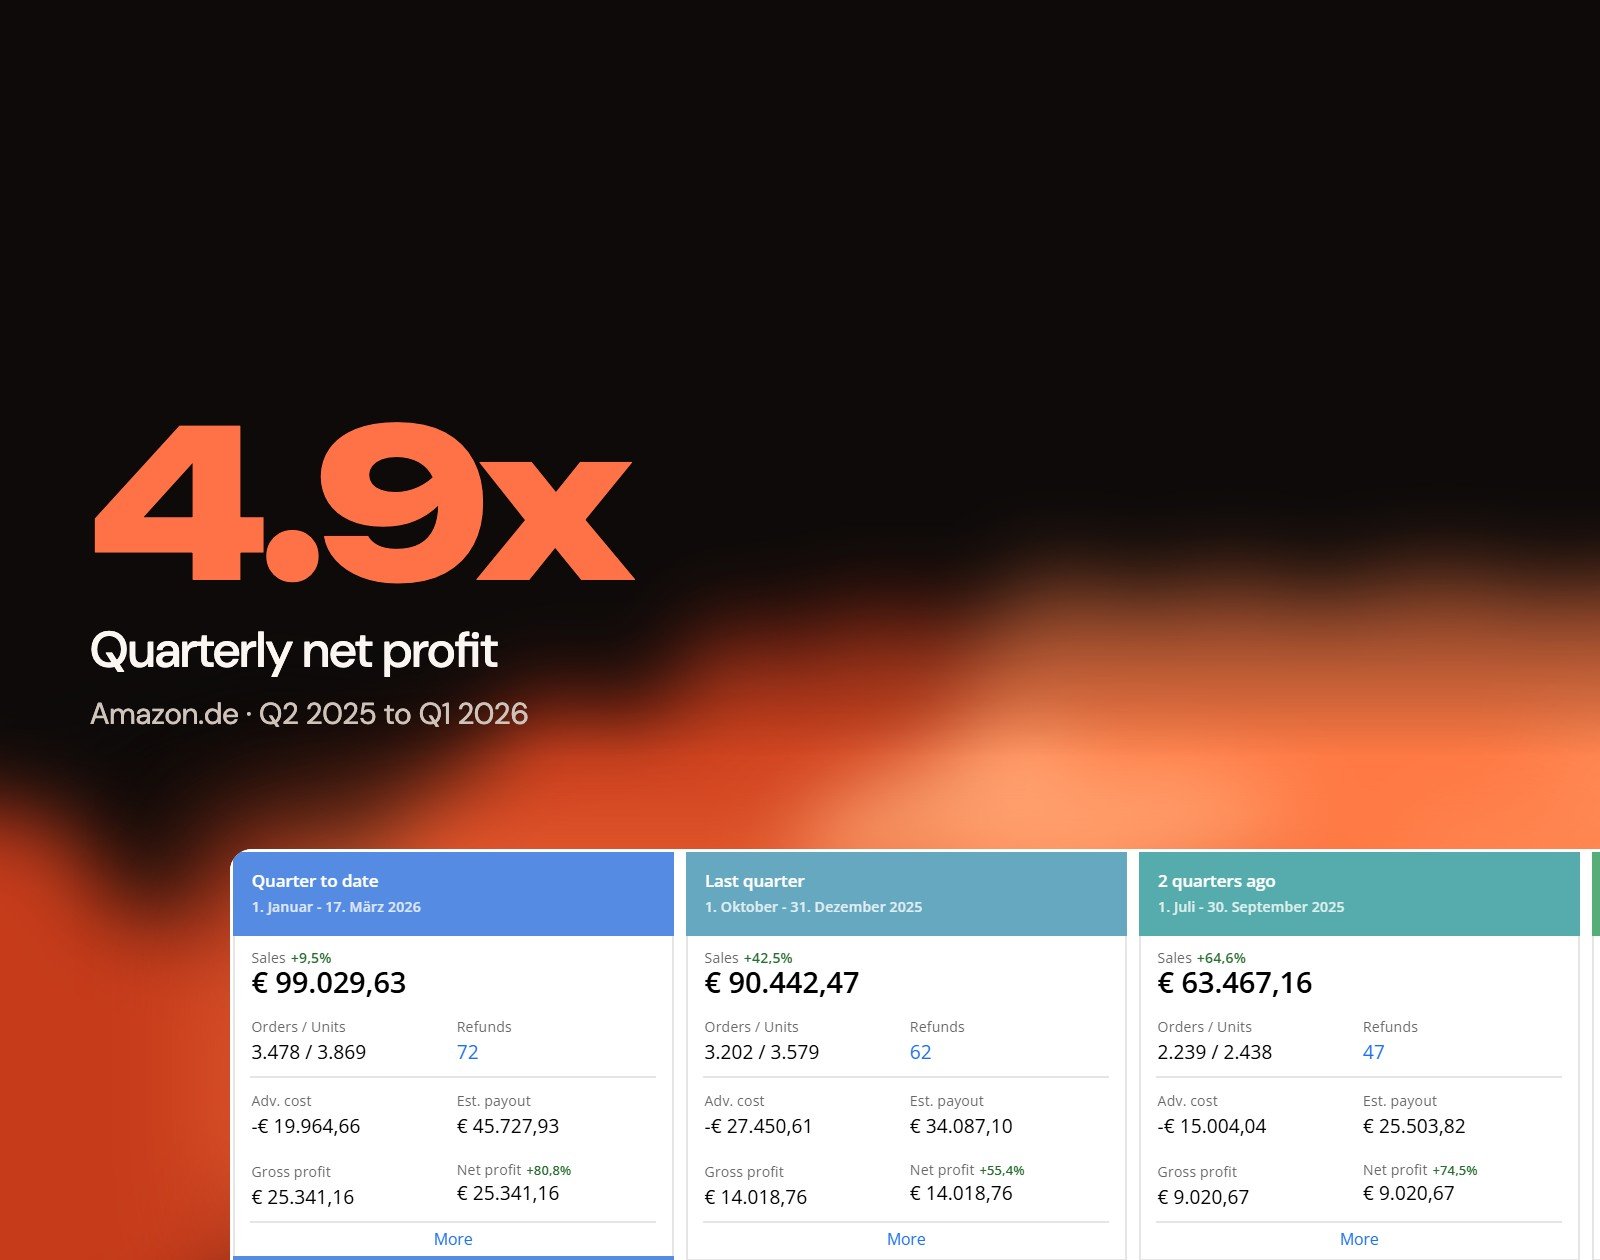
Net profit, Q1 2026
€25,341
Net margin, Q1 2026
25.6%
Sales, Q1 2026
€99,030
Quarterly net profit
4.9x
Quarterly sales
+157%
Ad cost share of sales
20.2%
01The problem
Anyone can buy sales. We had to grow the profit.
This Amazon.de account was growing, but it kept only 13.4% of its sales as profit. Ad costs rose with every extra sale, so the growth was being bought, not built. The brief was simple: make the bottom line grow faster than the top line.
Profit trailing sales
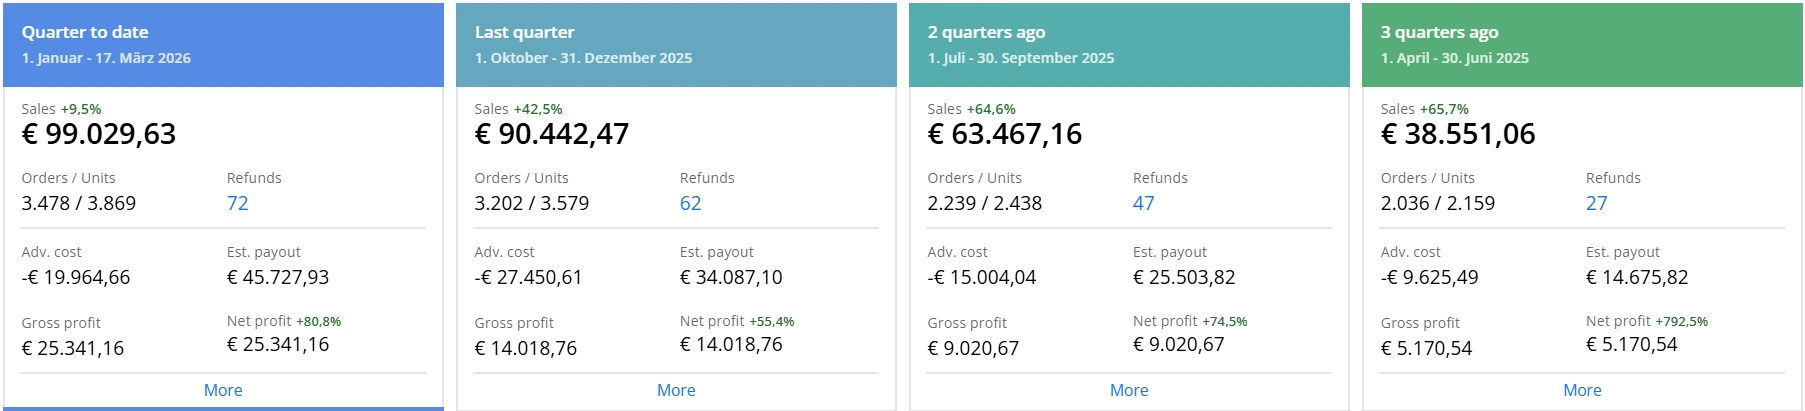
In Q2 2025 the account made €5,171 net on €38,551 of sales.
Ads growing with sales
Ad spend reached €27,451 in Q4 2025. More sales, same thin profit.
The Q1 test
Strong Q4 sales are easy. Holding them into Q1 without the holiday rush is the real test.
Refunds
Every refund costs twice, the sale and the fees. They had to stay low while volume tripled.
02What we did
We judged every decision by what it left in the bank.
- 1
Profit first
Every product, keyword and price judged by what it leaves after Amazon fees, ads and refunds, not by sales alone.
- 2
Lean advertising
A clean campaign structure kept ad costs growing slower than sales. Ad spend fell 27% from Q4 2025 to Q1 2026 while sales kept rising.
- 3
More organic sales
Steady sales built rankings, moving more orders to free, full-margin organic traffic every quarter.
- 4
Steady, not spiky
No discount binges and no bought quarters. Consistent numbers that carry into the next quarter.
03The results
| Measure | Before | After |
|---|---|---|
| Quarterly sales | €38,551 | €99,030 |
| Quarterly net profit | €5,171 | €25,341 |
| Net margin | 13.4% | 25.6% |
| Quarters of growth in a row | — | 4 |
Q2 2025 against Q1 2026. Q1 2026 runs only to 17 March 2026, so the quarter wasn't even finished.
04The proof
05Why it worked
Profit is a system
Fees, ads, refunds and price move together. Chase one number and the others eat it.
Efficiency is the cheapest growth
Q1's +80.8% profit came on +9.5% sales. It came from cutting waste, not buying revenue.
Consistency compounds
Four steady quarters beat one spectacular one.
Real data. Real business proof.
Ask for the full report: sales, profit, ad spend, ACOS and account performance, from before we started to today.
Your biggest Amazon months start here.
Ads, listings and brand, run as one system. Built to raise visibility, conversion and the number that matters most: profit.
Book a strategy call
Show us your listing. We will show you what we would change.
+25%
8.31% to 10.41%, comparing the same nine months one year apart.
110%+
Main images redesigned and tested against the old one. Not guessed.
3,600+
600+
Years of Amazon work
8
100%
- 600+ brands served
- Top Rated Plus on Upwork